Data Engineering / May 2026
How I Queried NYC Taxi Analytics Data — Directly in the Browser
Reading time
5 min read
1065 words
No dedicated query backend, no analytics API layer — just static files, DuckDB-WASM, and SQL running inside the browser.
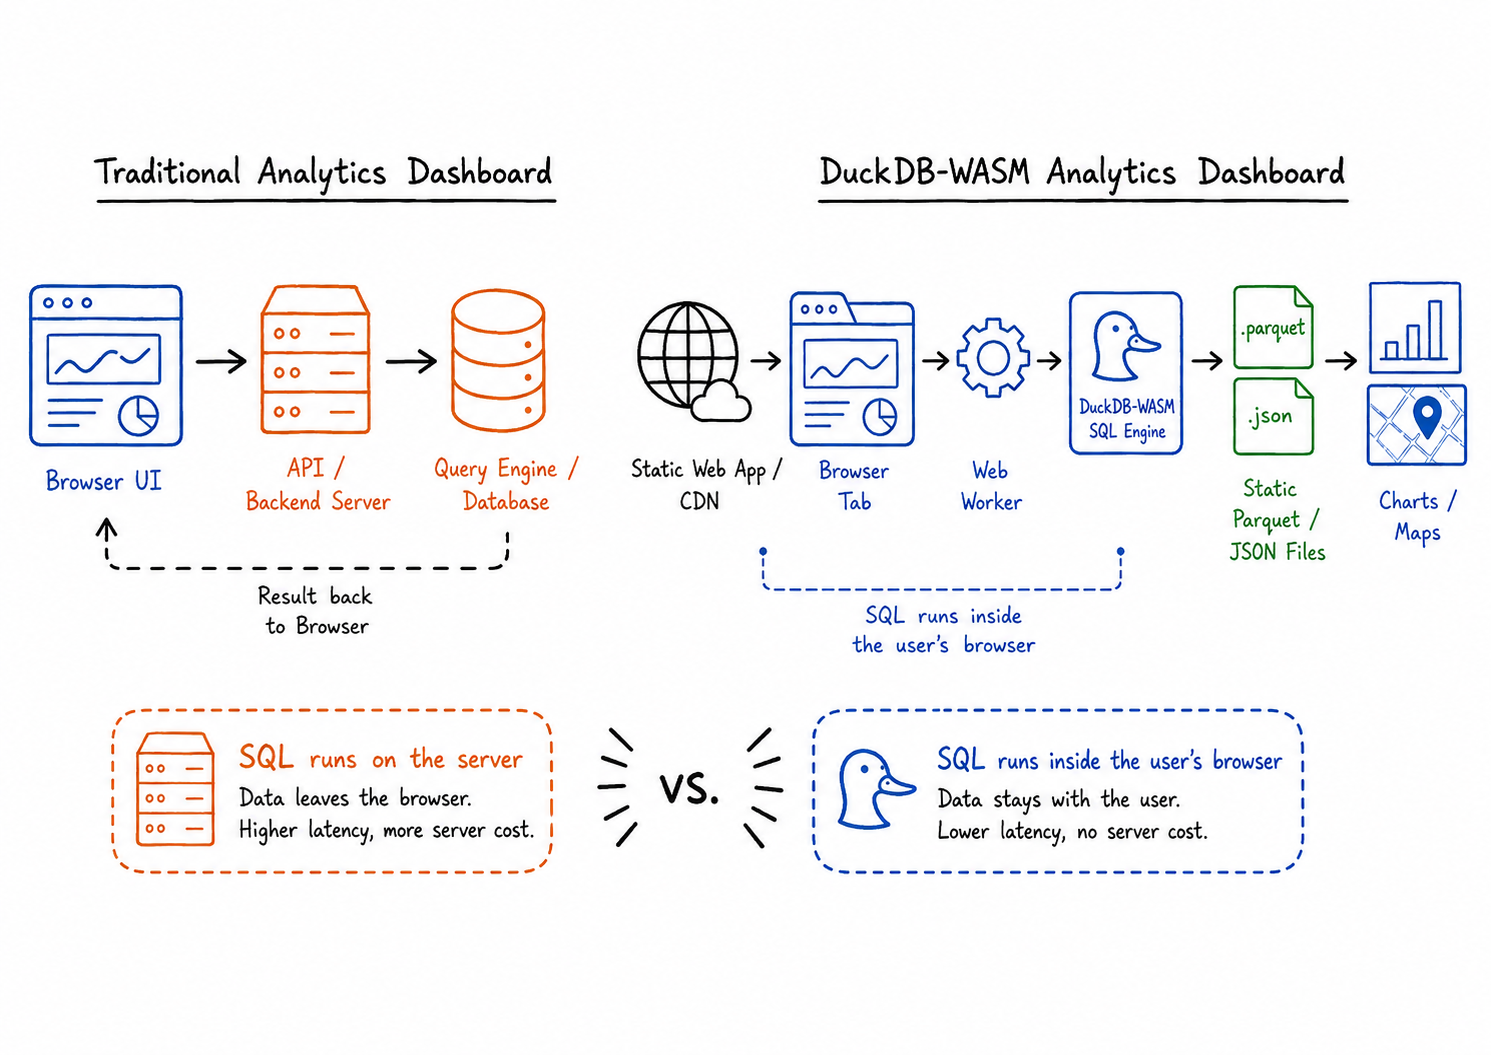
Every analytics dashboard I had ever built or studied followed a familiar blueprint: a frontend talks to a backend, the backend talks to a database, the database runs the query, and the result travels back to the browser.
That architecture still makes sense. In many cases it is the right choice. But while building ChronoRoute, a geospatial analytics dashboard for NYC taxi and ride-hailing data, I ran into a slightly different problem.
I already had a batch pipeline producing curated Gold-layer artifacts. I already had a static React application. The data did not need to update in real time, and most interactions were analytical reads: filtering, grouping, slicing, and aggregating prepared data.
So I started asking a simple question: do I really need a dedicated backend query server just to run SQL against static analytics files? That question led me to DuckDB-WASM.
01
The assumption worth flipping
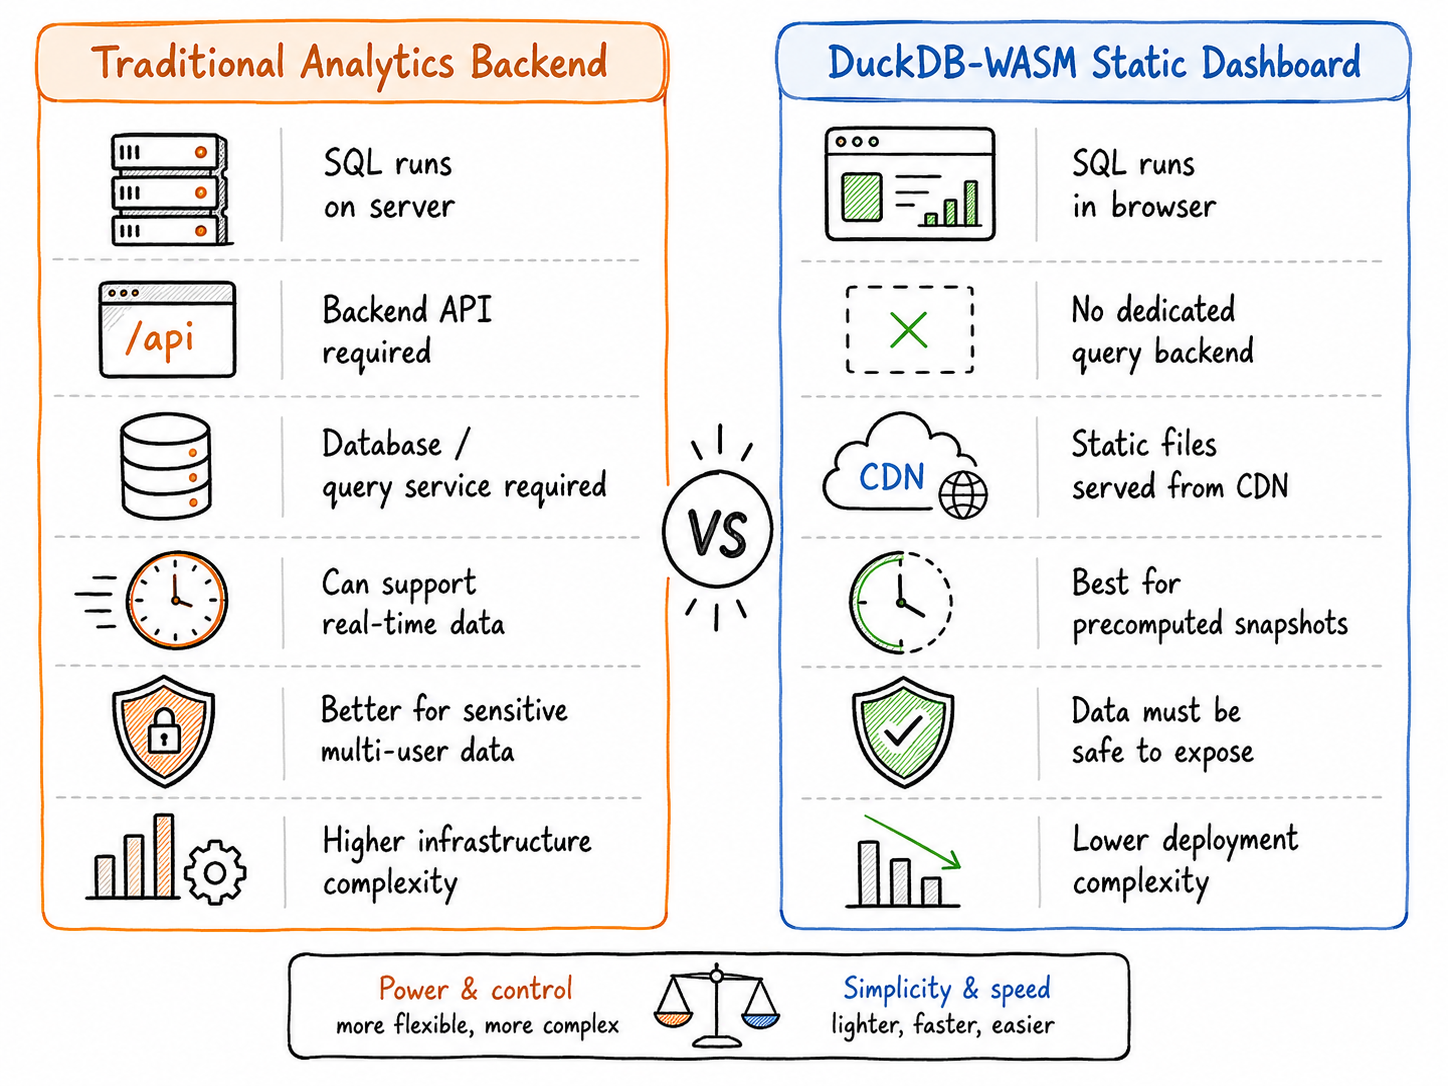
The common assumption is that an analytics dashboard needs a backend query layer. Usually, that is true. If the data is sensitive, frequently changing, personalized per user, or too large to ship to the client, the query layer belongs on the server.
DuckDB-WASM challenges that assumption for a narrower class of applications. It compiles DuckDB to WebAssembly, which allows the analytical SQL engine to run inside the browser. The precise claim is not “there is no server at all.” A static dashboard still needs something to serve HTML, JavaScript, the Wasm bundle, and data files.
The better claim is this: there is no dedicated backend query server. SQL execution happens locally in the user’s browser. The browser loads the app, fetches the data files it is allowed to access, runs analytical queries through DuckDB-WASM, and sends the result directly to the visualization layer.
02
What DuckDB actually is
The simplest framing is that DuckDB is like SQLite, but optimized for analytical queries instead of transactional application workloads. Like SQLite, DuckDB can run embedded inside another process. It does not require a separate database server to install, operate, or maintain.
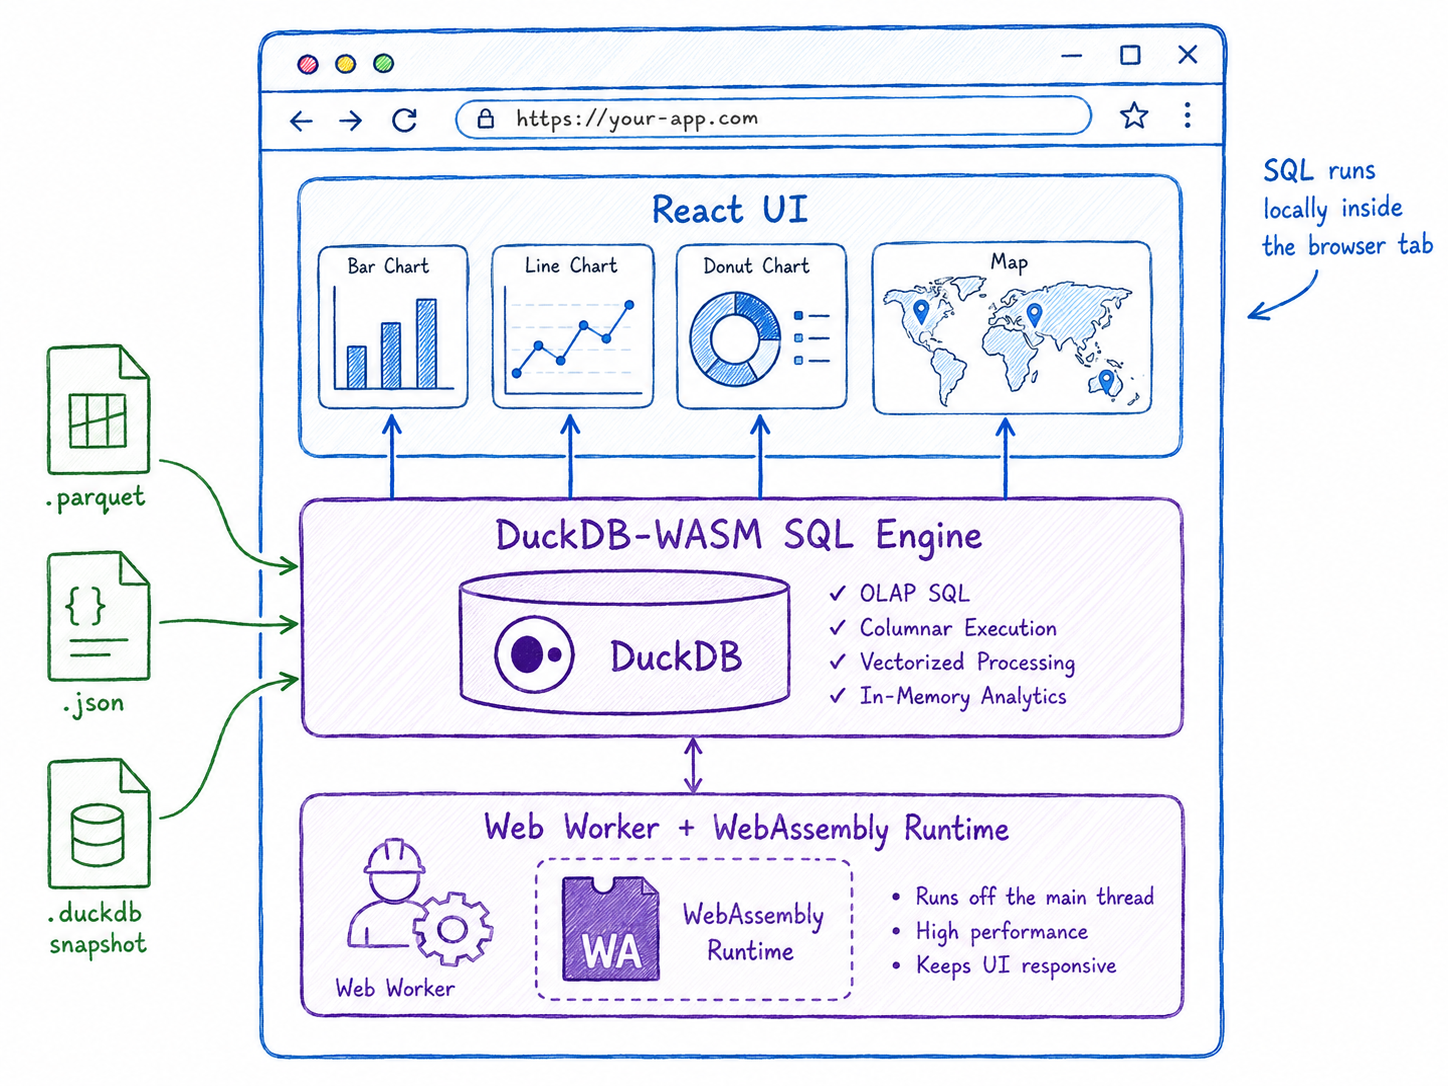
Unlike SQLite’s usual role in transactional application storage, DuckDB is designed for OLAP workloads: analytical queries that scan, filter, aggregate, and join larger datasets. DuckDB uses a columnar-vectorized execution engine, where batches of values are processed together instead of row by row.
For a dashboard, this changes the mental model. The frontend no longer has to treat data as arrays of JSON objects transformed with filter, map, and reduce. It can express analytical logic in SQL and let a real query engine handle the work.
03
Why WebAssembly changes the equation
WebAssembly is a low-level binary instruction format that can run in modern browsers. It acts as a compilation target for languages such as C, C++, C#, and Rust, allowing them to run on the web alongside JavaScript.
That is the bridge that makes DuckDB-WASM possible. DuckDB is written in C++, and through WebAssembly its query engine can run inside a browser tab. This is not a JavaScript reimplementation of SQL. It is DuckDB’s analytical engine compiled for the browser environment.
In practice, the browser becomes more than a presentation layer. It becomes a lightweight analytical runtime.
04
What the architecture looks like in ChronoRoute
ChronoRoute is not trying to make the browser process the entire raw NYC TLC dataset directly. That distinction matters. The pipeline does the heavy work first: raw NYC TLC data becomes cleaned models, then Gold-layer artifacts, then static files.
The browser handles the interactive last mile: filtering by time window, switching service type, selecting pickup and drop-off zones, querying precomputed metrics, and powering map and chart interactions.
The better claim is not “I made the browser process 20 million raw rows.” The better claim is: I processed millions of raw trip records in a batch pipeline, published compact analytics artifacts, and queried those artifacts directly in the browser.
05
Why Parquet matters
The naive version of browser-side analytics is to put a huge CSV file in the browser and hope for the best. That is not the pattern I wanted.
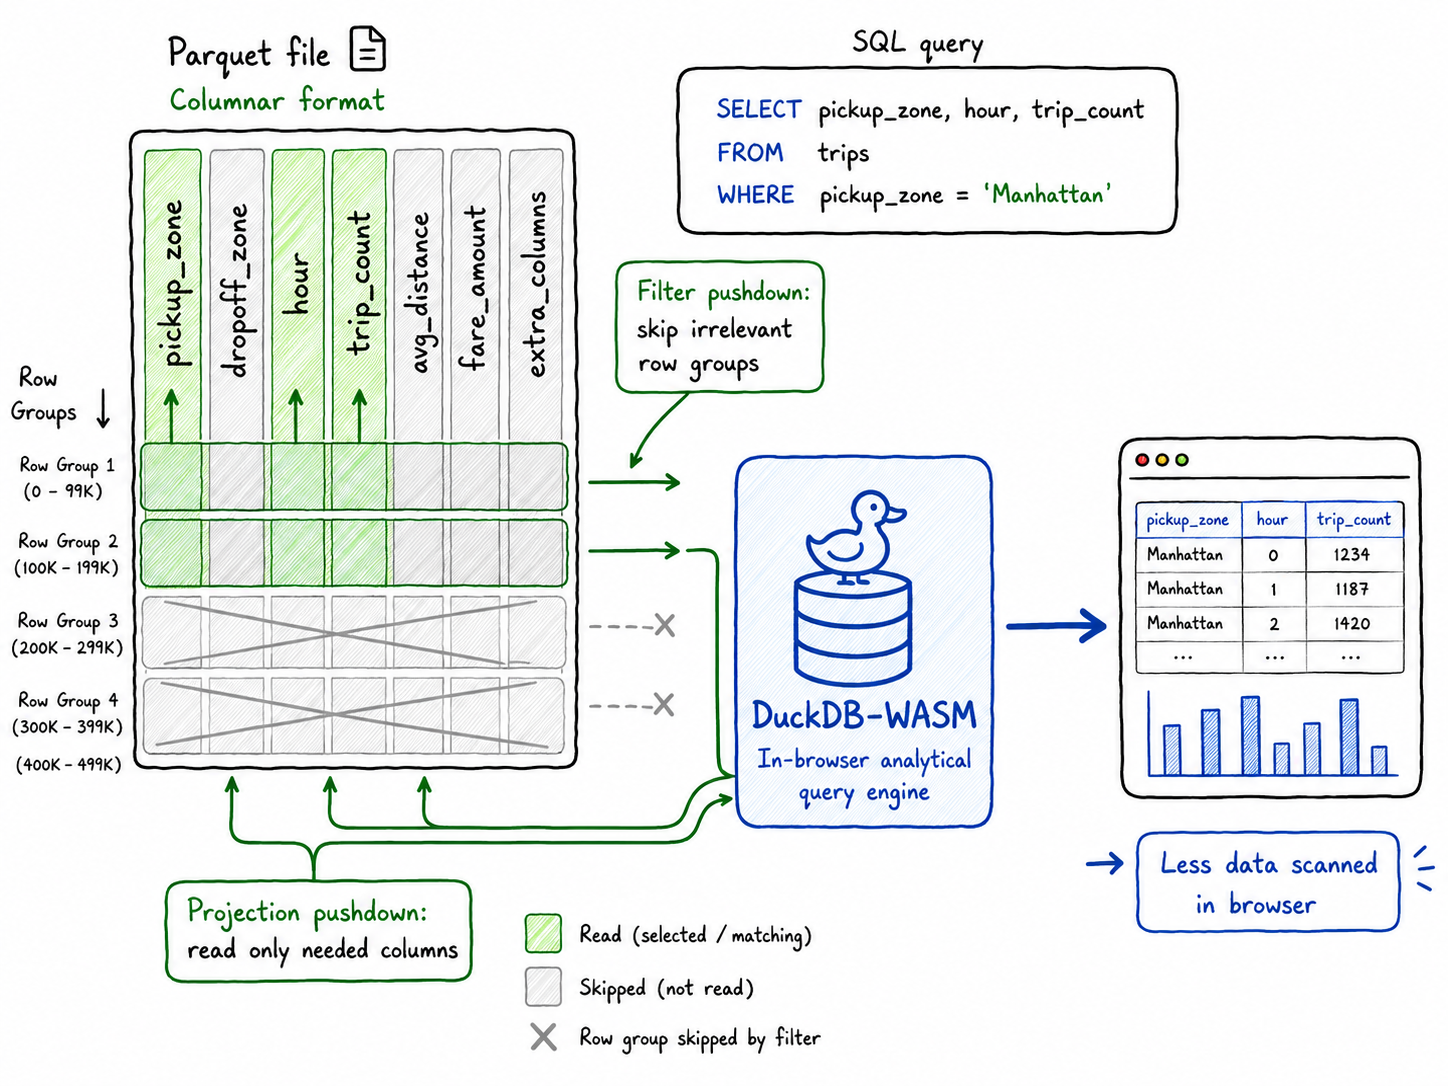
For analytical applications, file format matters. DuckDB has strong support for Parquet and can use optimizations such as filter and projection pushdown. That means the query engine can avoid reading irrelevant columns and, when the file is structured well, skip irrelevant row groups.
A file is still just a file. But to DuckDB, a Parquet file can behave like a queryable analytical table.
06
What this does and does not replace
This architecture does not replace data warehouses, PostGIS, or backend databases for transactional applications. It replaces one specific thing: a dedicated query backend for static or precomputed analytical datasets where the browser is allowed to receive the data.
A traditional backend analytics stack is still better when you need real-time data, sensitive data, per-user authorization, row-level security, very large working sets, centralized writes, multi-user coordination, or server-side governance.
DuckDB-WASM is strongest when the dataset can be distributed as a prepared extract and queried locally.
07
The pattern that makes it work
The mature version of this architecture is not raw data to browser to hope. It is raw data to batch pipeline to cleaned model to aggregated or partitioned artifacts to static hosting to DuckDB-WASM to interactive dashboard.
That means doing the heavy data engineering work upfront. In ChronoRoute, raw NYC TLC trip records are processed through the pipeline, aggregated into dashboard-friendly grains, stored as compact artifacts, served statically, and queried by DuckDB-WASM in the browser.
The browser should not be responsible for turning operational-scale raw data into a data product. It should be responsible for the last-mile interaction. That distinction is what makes the architecture credible.
08
The broader point
DuckDB-WASM is not interesting because it lets us avoid backend engineering at all costs. It is interesting because it gives us another architectural option.
For public, static, precomputed, read-heavy analytics applications where the data is safe to expose to the client, a dedicated query backend may be unnecessary. Instead, we can ship prepared data files, load an analytical SQL engine in the browser, and let users explore the data locally.
That is the middle ground ChronoRoute uses: more powerful than a static chart, simpler than a full analytics backend, and good enough for many public data products.