Data Engineering / May 2026
Building StreamPulse: Lessons from a Batch-First Azure Lakehouse
Reading time
4 min read
771 words
What I learned from building a cost-aware Azure lakehouse for subscription streaming analytics, from synthetic sources to Metabase dashboards.
StreamPulse started as a portfolio project, but the useful lesson was not “use Azure tools.” The useful lesson was that a data platform becomes credible when every layer has a clear contract: source data, landing files, Bronze audit fields, Silver conformance, Gold facts and dimensions, serving marts, and dashboard views.
The project models a fictional subscription video streaming business. The questions are intentionally familiar: are active users growing, which plans churn, what content keeps people engaged, where does the trial-to-paid funnel leak, and how trustworthy is the revenue view?
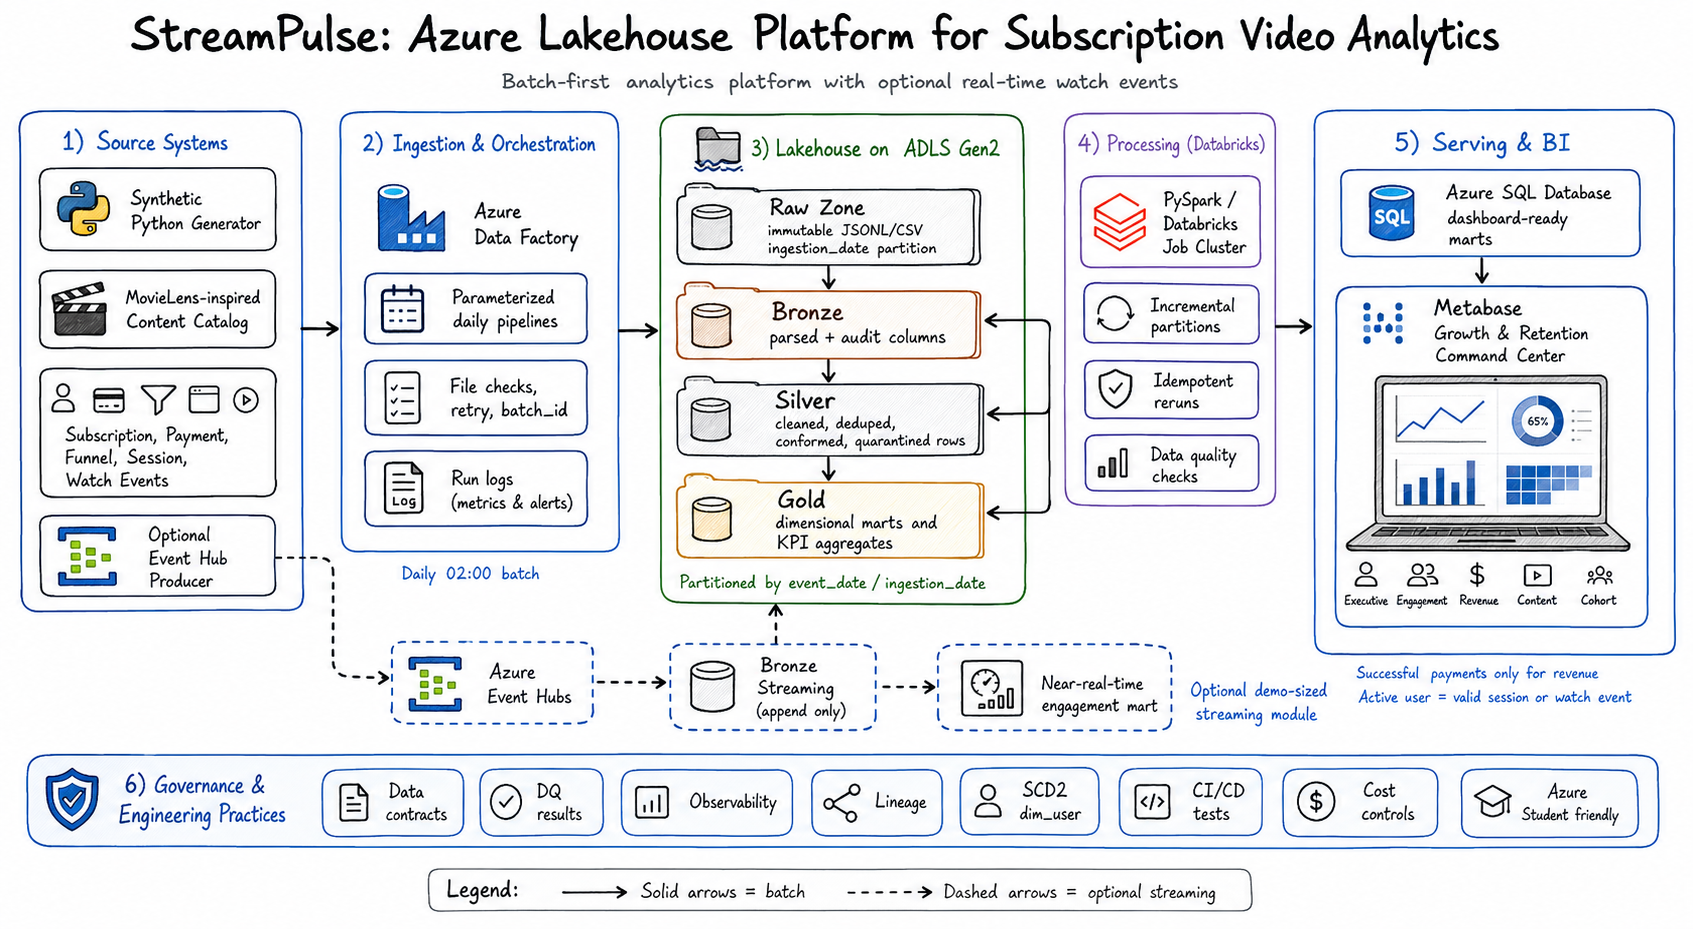
The architecture is batch-first on purpose. Instead of spending cloud credit on always-on streaming, StreamPulse proves the analytical workflow end to end: generate source-like data, orchestrate ingestion with Azure Data Factory, land files in ADLS Gen2, transform through lakehouse layers, load compact marts into Azure SQL, and provision Metabase for dashboard consumption.
01
Lesson 1: batch-first is still a serious architecture
It is tempting to make every modern data engineering project real-time. StreamPulse reminded me that freshness is a product requirement, not a badge. For a subscription analytics dashboard, daily or scheduled batches can be the right trade-off when the goal is reliable leadership reporting, cost control, and repeatable evidence.
The local implementation runs the full flow with Python, JSONL/CSV outputs, data quality summaries, a SQLite serving database, Metabase-ready extracts, and a static showcase dashboard. The Azure path mirrors the same shape with ADF, ADLS Gen2, Databricks/PySpark, Azure SQL, and Metabase. That symmetry matters because the local path is not a toy; it is a low-cost rehearsal for the cloud path.
02
Lesson 2: medallion layers are only useful when they change responsibility
A Bronze/Silver/Gold structure can become naming theater if each layer does not do different work. In StreamPulse, Landing keeps source-like daily files, Bronze adds ingestion metadata such as source file, batch id, record hash, quarantine state, and quality status, Silver deduplicates and conforms entities, and Gold creates facts, dimensions, and marts.
That separation gives the platform a debugging path. If a metric looks wrong in Metabase, the question is not vague. Did the generator create the event? Did Bronze audit it? Did Silver dedupe it? Did Gold assign it to the right grain? Did the serving view define the business metric correctly?
03
Lesson 3: the metric contract is more important than the dashboard
The dashboard is the visible artifact, but the platform’s value sits in its metric definitions. StreamPulse defines active users as users with valid sessions or watch events, revenue as successful payments, churn as cancellation or effective subscription end, and completion as playback with completion percentage above the chosen threshold.
Those choices make the executive view explainable. MRR, ARPU, churn, completion, content performance, payment failure risk, and cohort retention are not just charts. They are contracts between data engineering and business interpretation.
04
Lesson 4: serving marts should protect the BI tool from raw complexity
One of the better design choices was building compact senior analytics marts before Metabase reads the data. The serving layer includes tables such as analytics_kpi_monthly, analytics_engagement_daily, analytics_subscription_health, analytics_content_portfolio, analytics_funnel_conversion, analytics_payment_quality, and analytics_cohort_retention.
That keeps the dashboard fast and readable. Metabase should not have to reconstruct the lakehouse every time someone opens a card. The BI layer should receive analysis-ready tables with stable grains and clear semantics.
05
Lesson 5: evidence turns a portfolio project into an engineering case study
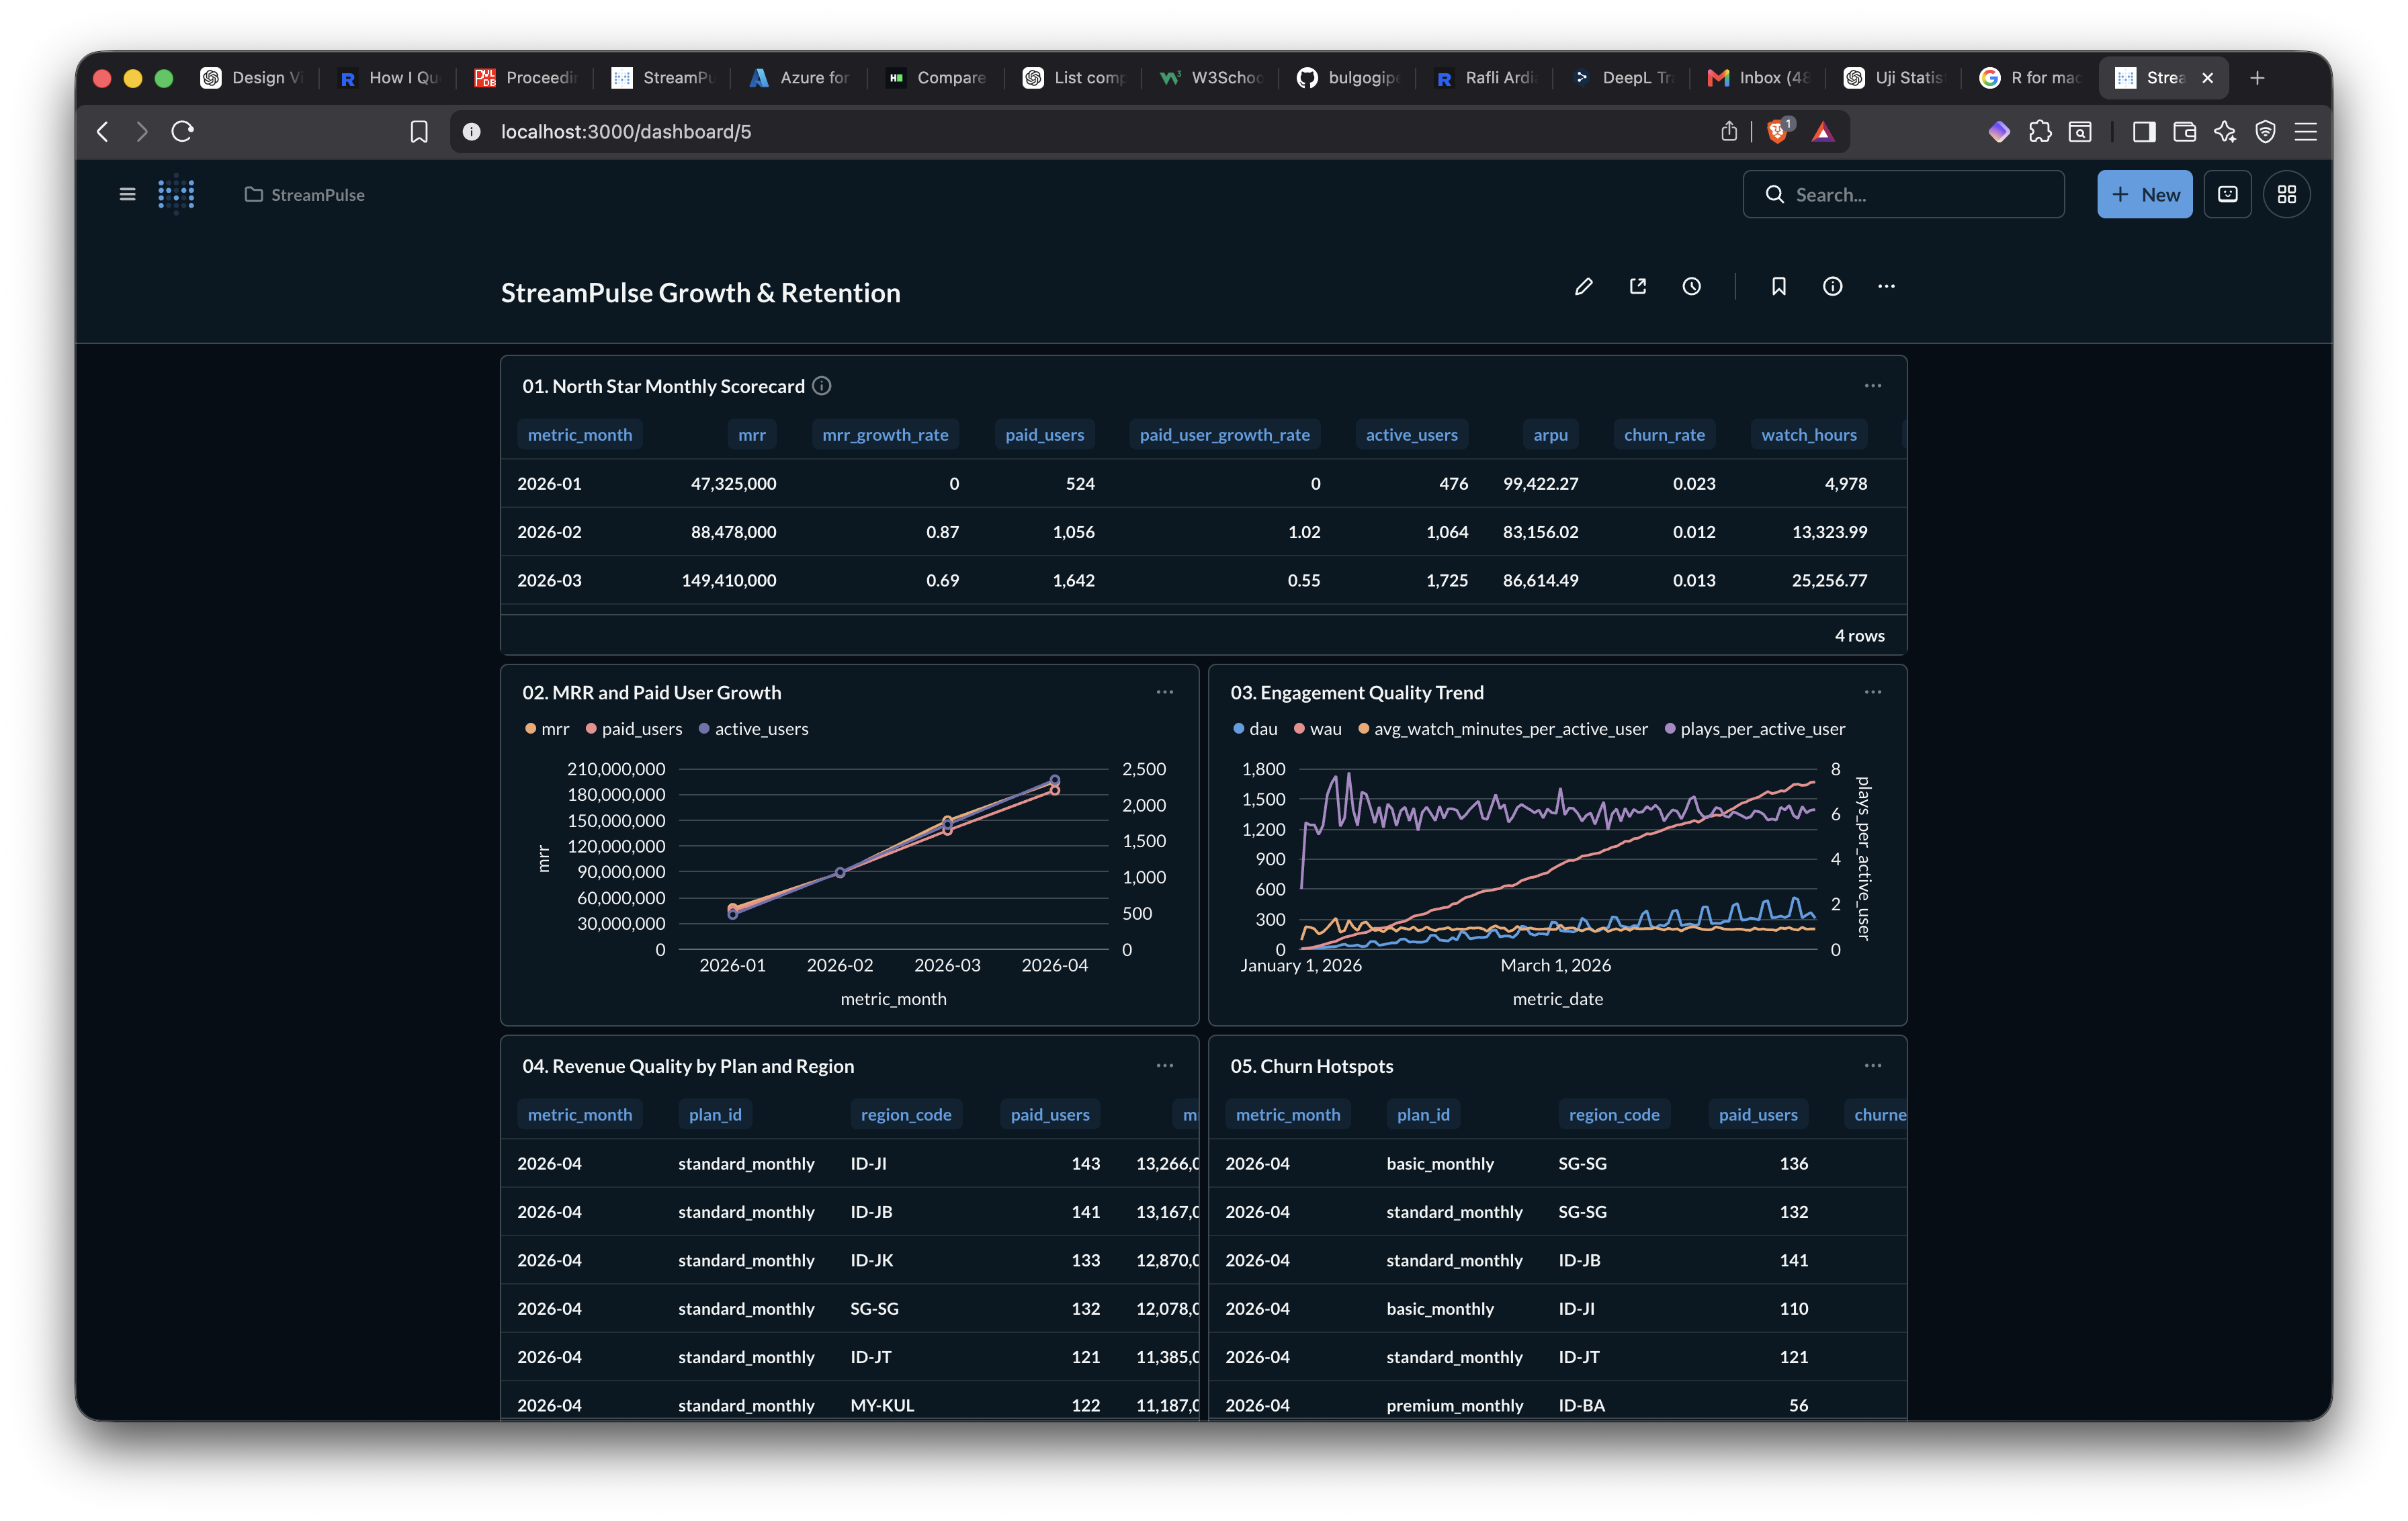
The project is stronger because it includes proof, not only architecture diagrams. The local pipeline produces serving files and quality outputs. Azure Data Factory ingestion was validated with a real run id and raw ADLS paths. Azure SQL serving tables and dashboard views return rows. Metabase provisioning creates a Growth & Retention Command Center with ten cards.
For a portfolio, that evidence matters. It shows that the project is not only a planned architecture; it is a working system with generated data, transformation layers, quality checks, serving tables, dashboard artifacts, and screenshots that document the path from source to insight.
06
What I would improve next
The next upgrade would be a small Event Hubs demo, not a full streaming rewrite. A compact stream for session or watch-event activity would let the system demonstrate freshness without changing the core architecture into something expensive to operate.
I would also add dbt tests against the Azure SQL serving layer and a Databricks job-cluster version of the local jobs. The goal is not to chase every tool, but to strengthen the contract between lakehouse storage, transformation logic, serving views, and dashboard trust.